The staff of experienced developers and algorithmists of NAVIS, the accumulated expertise in the field of control systems and mathematical modeling, allow the company to develop and create specialized software, taking into account the requirements of a particular customer. The company plans to include its own software in the unified register of Russian programs for electronic computers and databases.
DP SafeWatch
Purpose of DP SafeWatch
Oil company:
- Collision risk management
- Improving logistics through analysis of maneuvers in and around safety zones, including waiting times
- Real-time vessel status monitoring
SUDP Operators:
- Solution support incl. Visual + OAP
Shipowner
- Compliance of operator actions with rules
- Compliance of operators’ actions with safety standards
- Vessel technical condition monitoring
DP SafeWatch Features
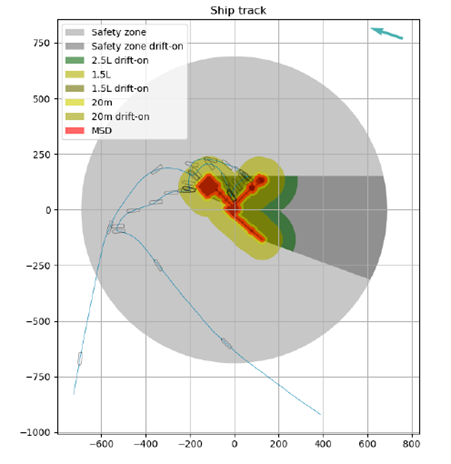
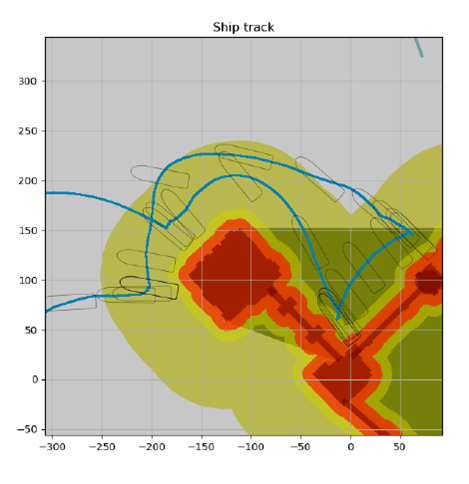
- Graphic display of the platform, its Safety Zone, current restrictions, external influencing factors, points of approach and other vessels
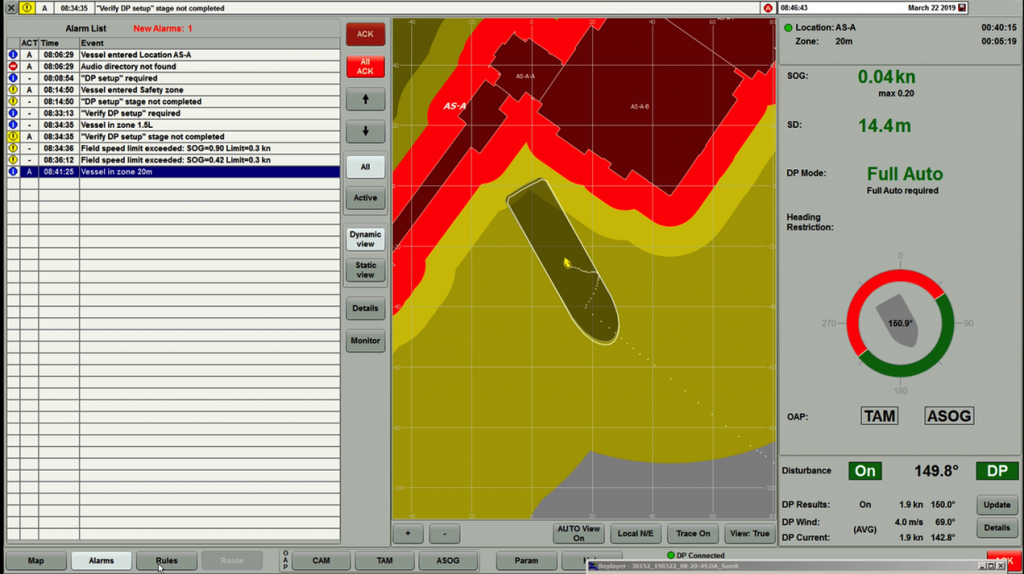
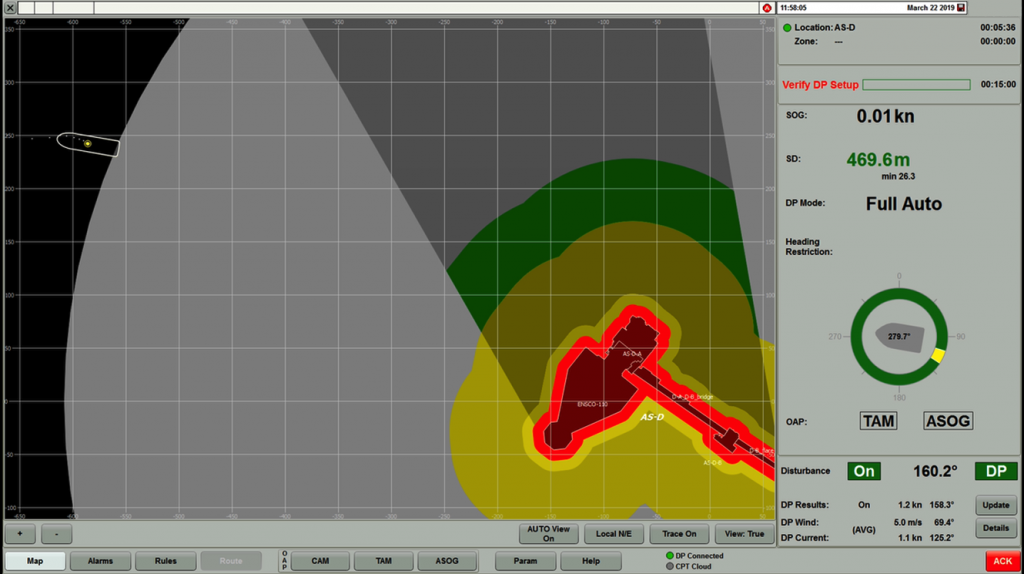
- Assessment of compliance of the ship’s motion parameters with the rules of the current Safety Zone with recommendations for the operator
- Assessment of compliance of the configuration of the DP system and the vessel with the required OAP (CAM, TAM, ASOG)
- Laying the optimal routes for approaching the platform and departing from it, taking into account the current rules of the Safety Zone and external influencing factors (wind, current), as well as other vessels
- Remote monitoring of the ship’s behavior in the Safety Zone and the state of the ship’s DP system
- Preparing ship/fleet reports
- Accumulation of data on the work of ships in the Security Zones for further work on automating the operations of supply ships, incl. for future autonomous ships
NavGrapher
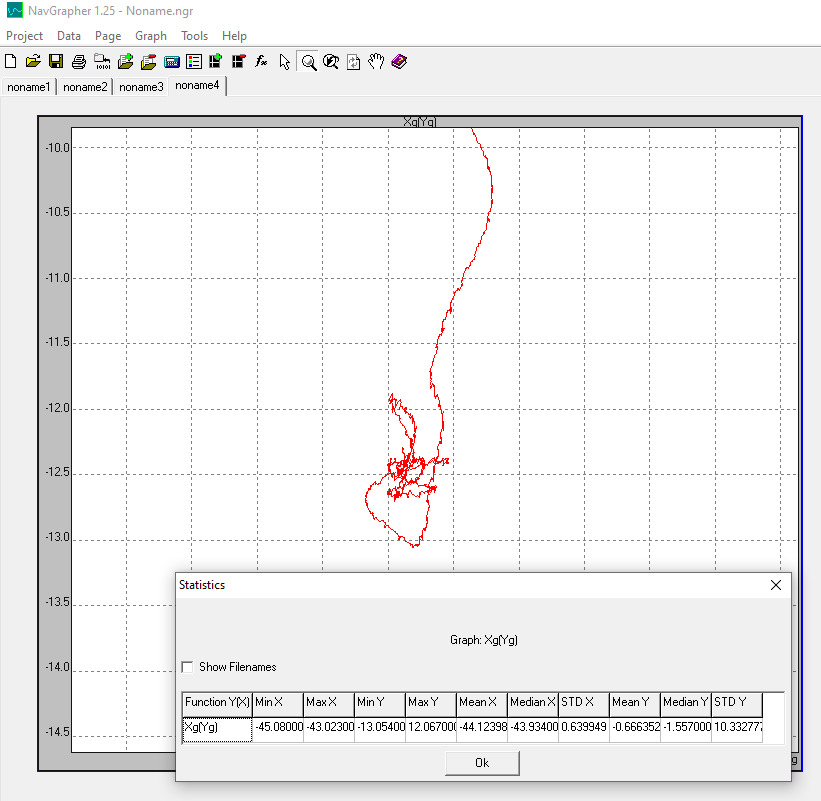
NavGrapher is a graphing utility for tabular data. Allows you to carry out express analysis of experimental data, save typical sets of graphs in the form of a “project”. Supports the ability to analyze multiple files, view statistics for a fragment of a file, change the scale of the graph, including equal scale along the axes for plotting motion trajectories. Convenient for plotting graphs when analyzing the operation of automatic motion control systems.
As an example, in the graph on the right – the movement of the center of the vessel in the local earth system (N / E) during the execution of the maneuver (approaching the positioning point)
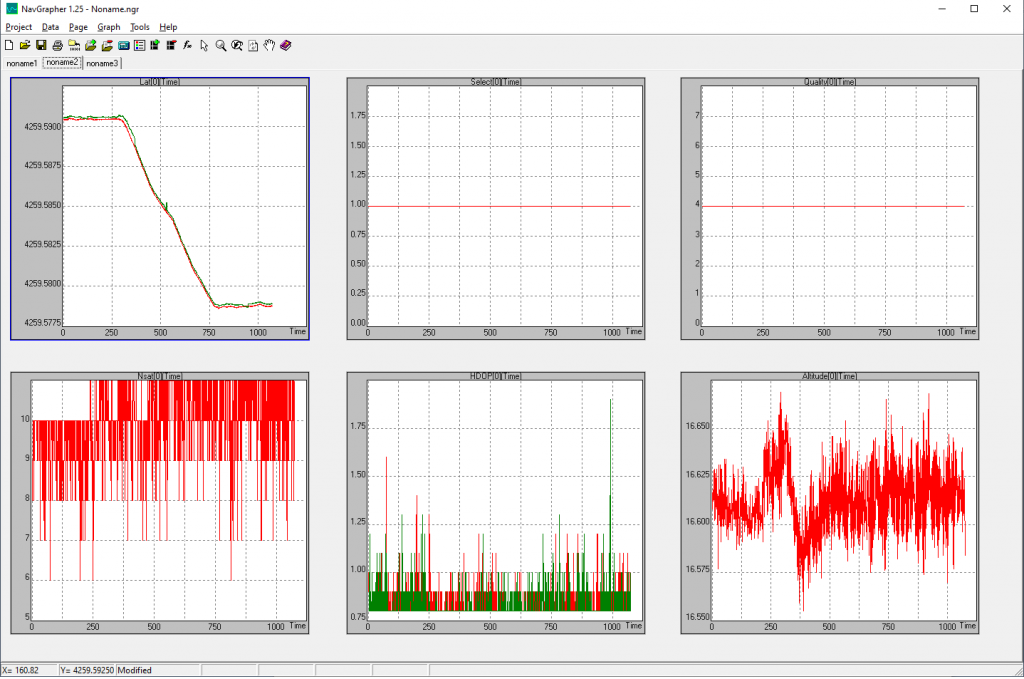
Below are graphs of GPS/GLONASS receiver measurements during sea trials. The graphs show the comparative readings of the two receivers, in particular, the height readings, the number of visible satellites, the quality of work (HDOP indicator), etc.
NavDLA
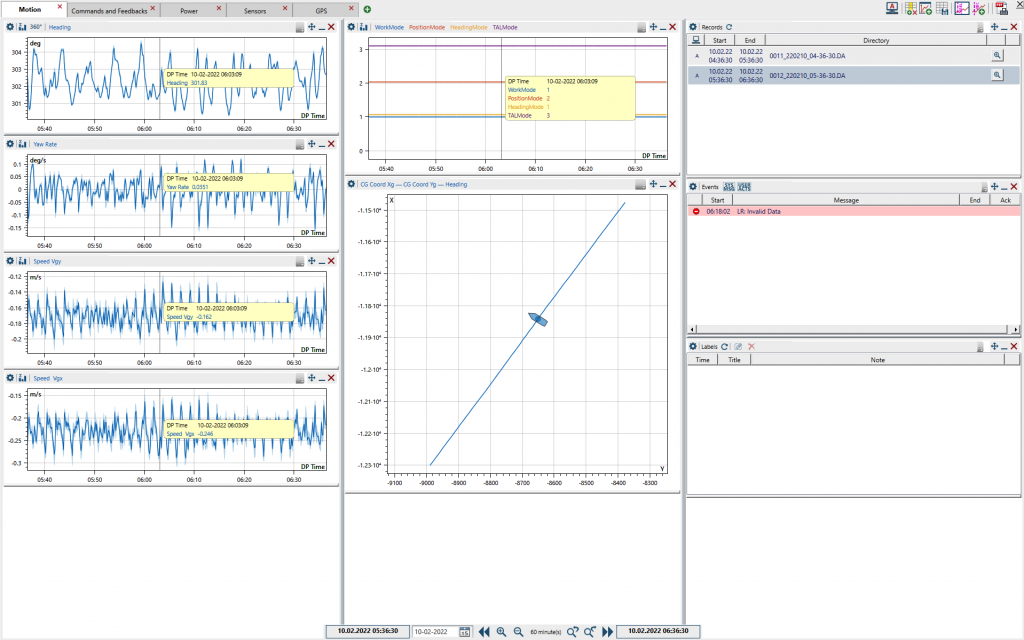
NavDLA (DataLoggerAnalyzer) is a product that is installed on a station for network data logging.
NavDLA maintains a PostgreSQL database of records into which dynamic position records are imported.
NavDLA allows you to:
- View the history according to the charts entered into the database (for a given period of time), show time cutoffs by operator time
- Select data from different DP hosts (DPA, DPB, IJ)
- Create labels for data (labels are stored in the database)
- Create custom screen templates
- Print reports (to printer or file)
Interface languages:
- English
- Russian
Function bar
DLA Main Screen, View Graphs and Time Cut
Setting labels
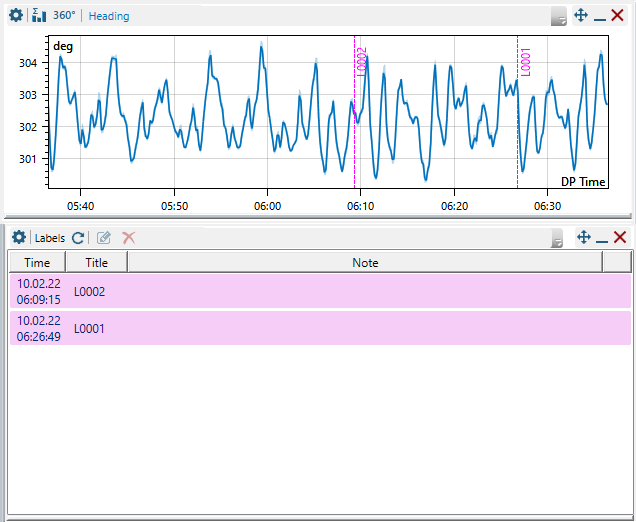
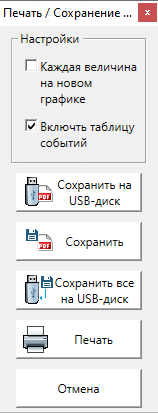
Printing reports
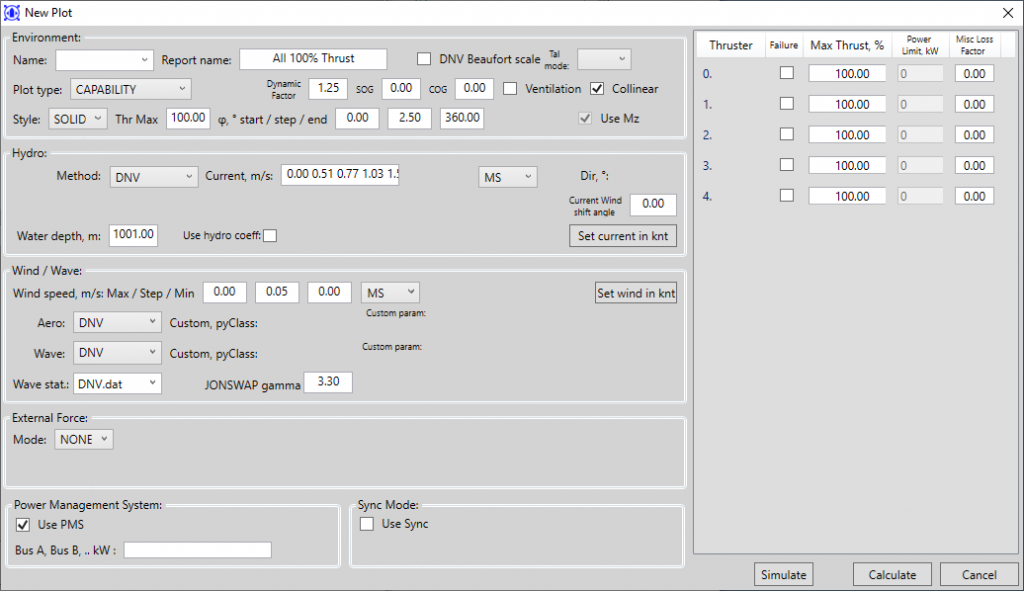
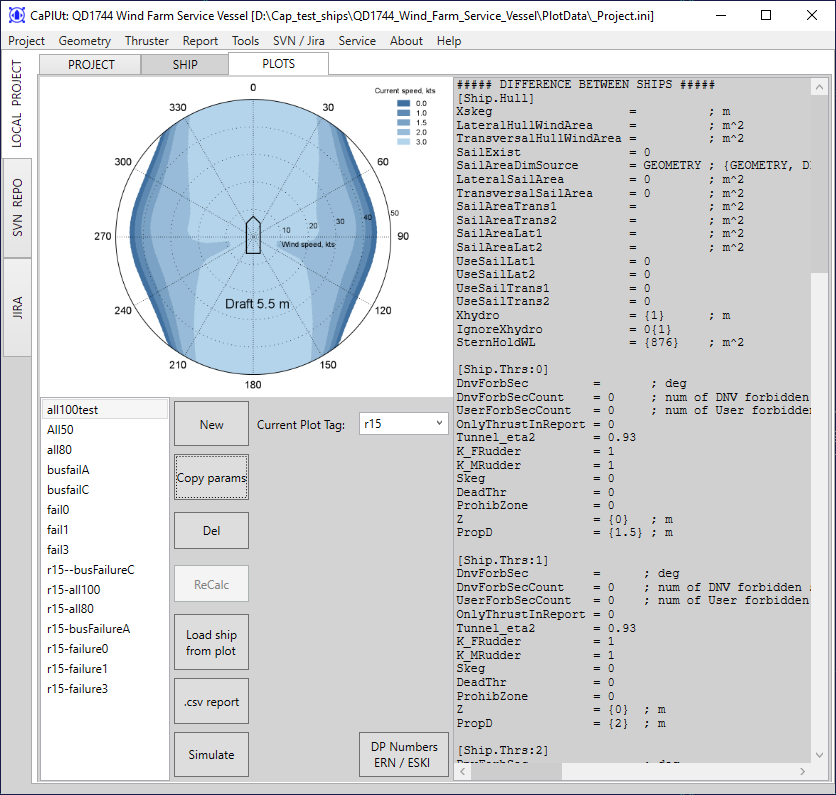
DP Capability Plot
Purpose:
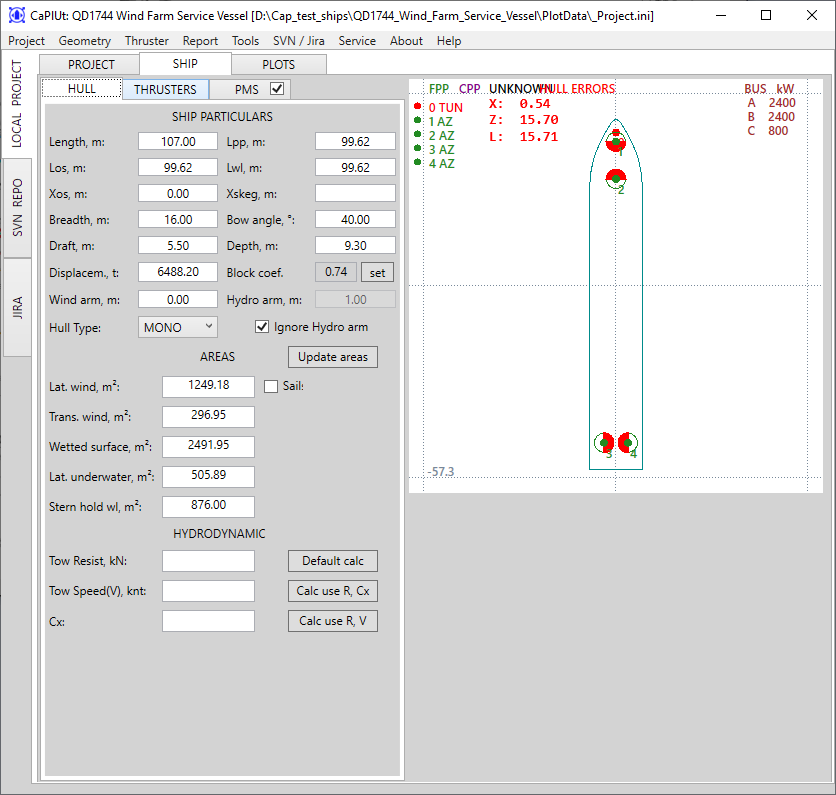
Determination of the holding pattern in the dynamic positioning mode, taking into account the failures of the controls, as well as various external influences.
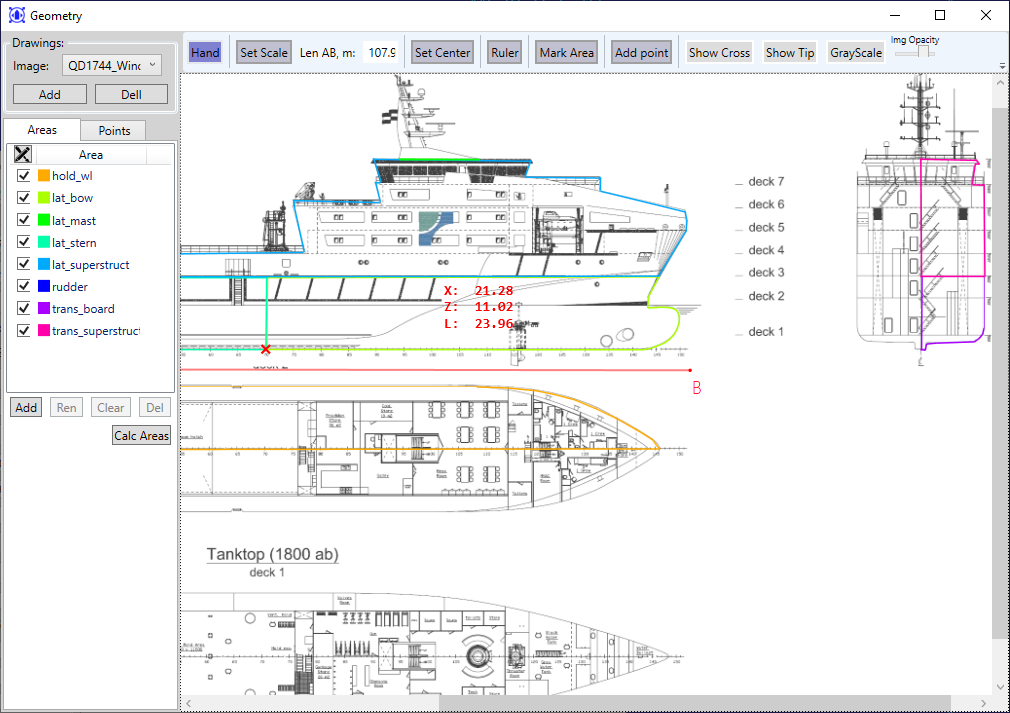
Functions:
- Digitization of the contours of the vessel, determination of areas (in particular, areas of sail
- Checking the entered data on the vessel for correctness
- Evaluation of forces according to various methods (including methods of various classification societies) classification societies DNV, BV, ABS
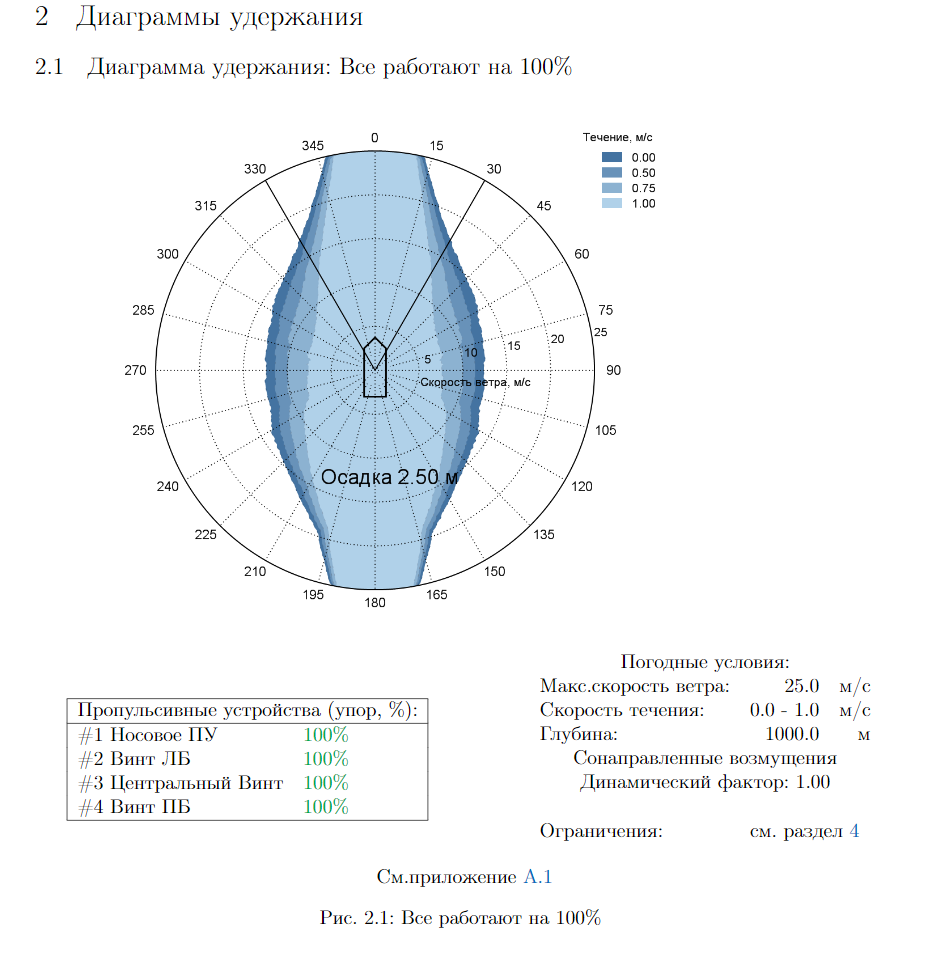
- Define a retention chart for given conditions
- Defining a Controls Load Chart for Given Conditions
- Formation of a report in pdf format that meets the requirements of classification societies
Report languages:
- English
- Russian
CONTACTS
«NAVIS»
We are always glad to see you:
199106, St. Petersburg, 22-nd line V. O., 3, building 5, letter E


Do you have any questions?
Leave your contacts, we will call you back: